Aseba Studio
Aseba Studio is an integrated development environment within which we edit and debug the programs of all nodes of an Aseba network.
The environment
Concurrent editing
Within Studio, each node of an Aseba network has its own tab with its program, memory content, execution status, and debugging commands. In addition, a toolbar provides general commands which affect all the nodes. This allows both an overall control of the network and a specific control of each node.
Powerful editor
The program editor provides syntax highlighting, indentation of blocks, and dragging of variables’ names from memory. It also shows the current position of execution in step by step mode and colours errors in red.
Instant compilation
Studio recompiles the program while the developer is typing it. The result of compilation (success or a description of the error) is displayed below the editor. This permits the correction of errors as soon as they appear, which increases the quality of the code.
Data inspection
Studio lists the variables available on each node with their values. We can update this list in a single click. This list provides a quick overview of the state of the node.
Debugger
Studio has an integrated debugger; for each node, it gives the current execution status. It supports continuous execution, step by step, and breakpoints. A right click inside the program editor allows to set or clear a breakpoint on a specific line. After a breakpoint or a step, the values of the variables are updated.
Constants definition
We can define constants which are available on all the nodes. Constants can be re-ordered by drag and drop.
Network-wide events
We can specify the names of the events, and by double-clicking on a name, we can send the corresponding event. A right-click on an event allows to plot this event over time. Events can be re-ordered by drag and drop.
Below the list of event names, a log shows the recent events along with their time stamps and parameters. This allows the monitoring of the distributed behaviour in the network.
Local events, native functions and plugins
Studio shows the local events available on each node. It also lists its native functions. The tool-tip of each function gives a short documentation. A list of node-specific plugins is also provided, if any.
Event plotting in Aseba Studio
Aseba Studio allows the data of global events to be plotted over time. To do so, in a node tab, right click on a global event and select “Plot event data”. This creates a new tab with a 2D plot of the event data over time:
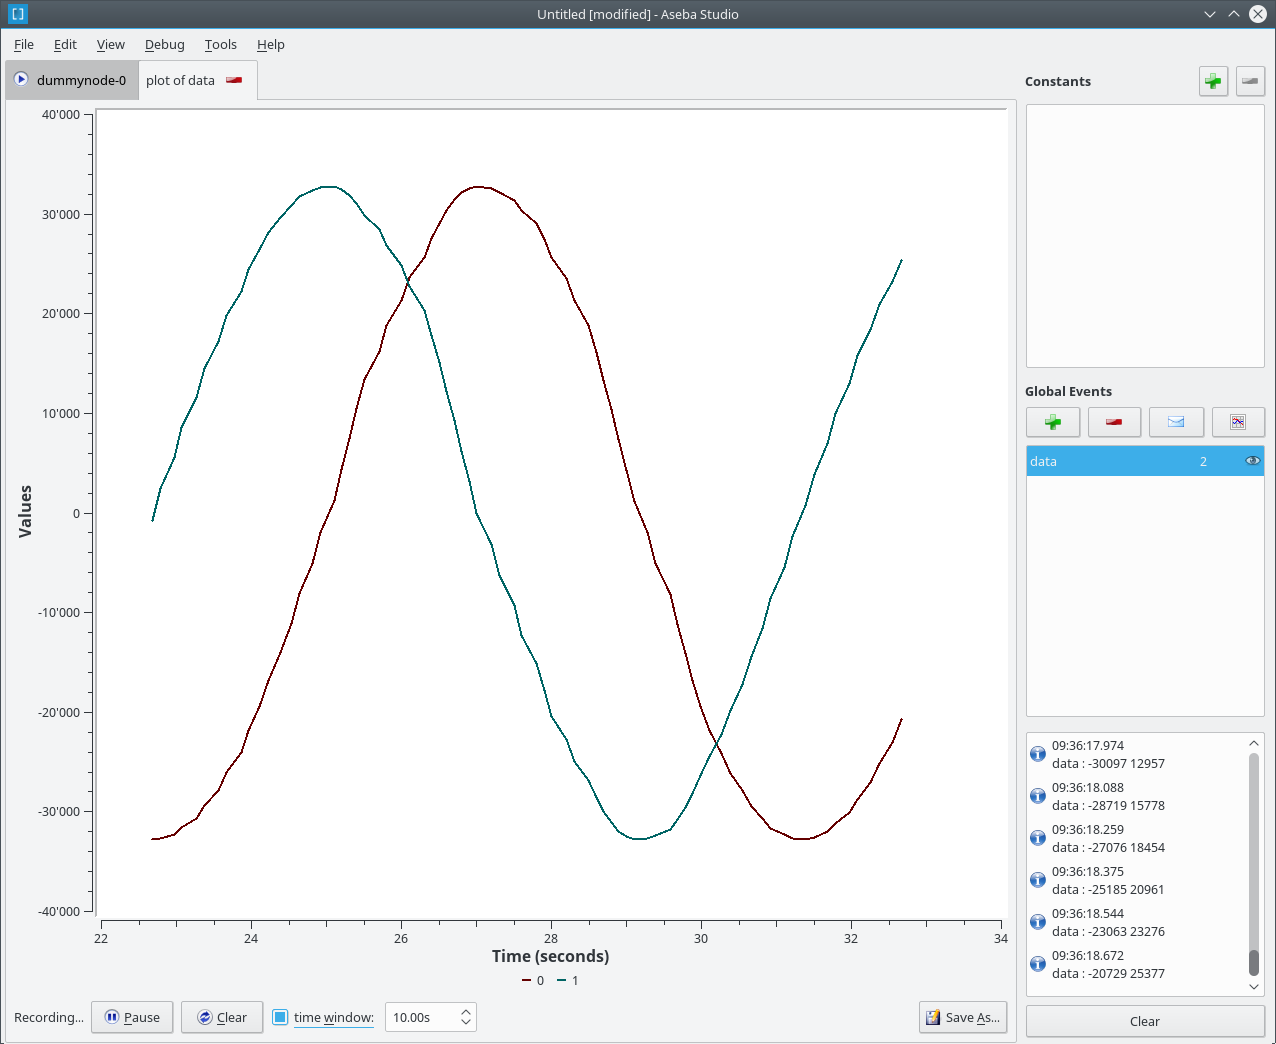
The y-axis scales automatically. The x-axis spans the whole duration of event data recording, with a maximum of time window if the latter is set. The recording can be started and stopped, and the data can be cleared. At the bottom-right part of the tab, a Save As button allows the event data to be saved in a text file. Each line will contain a timestamp and the values of the event data, separated by a space.
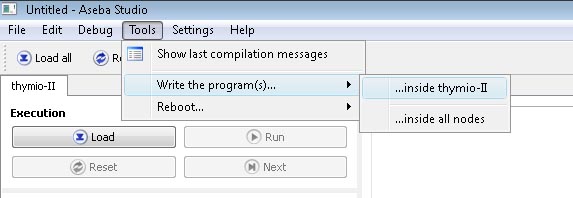
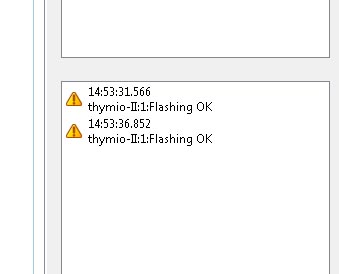
Flashing user code in Thymio
It is possible to save a user code in Thymio II so that, even when turned off, Thymio keeps the code. The saved behaviour will be accessible through the menu, the colour of your code is “colourless”. Once this code is launched, the user cannot go back in the selection menu unless the robot is restarted.
To save the code in Thymio II
- Load the code, without running it.
- Click on “Tools” -> “Write the program(s) …” -> “… inside Thymio-II”.
- Check in the window of the event if “Flashing OK” appears.